XRP has fallen 3 straight Marches will 2026 break the streak
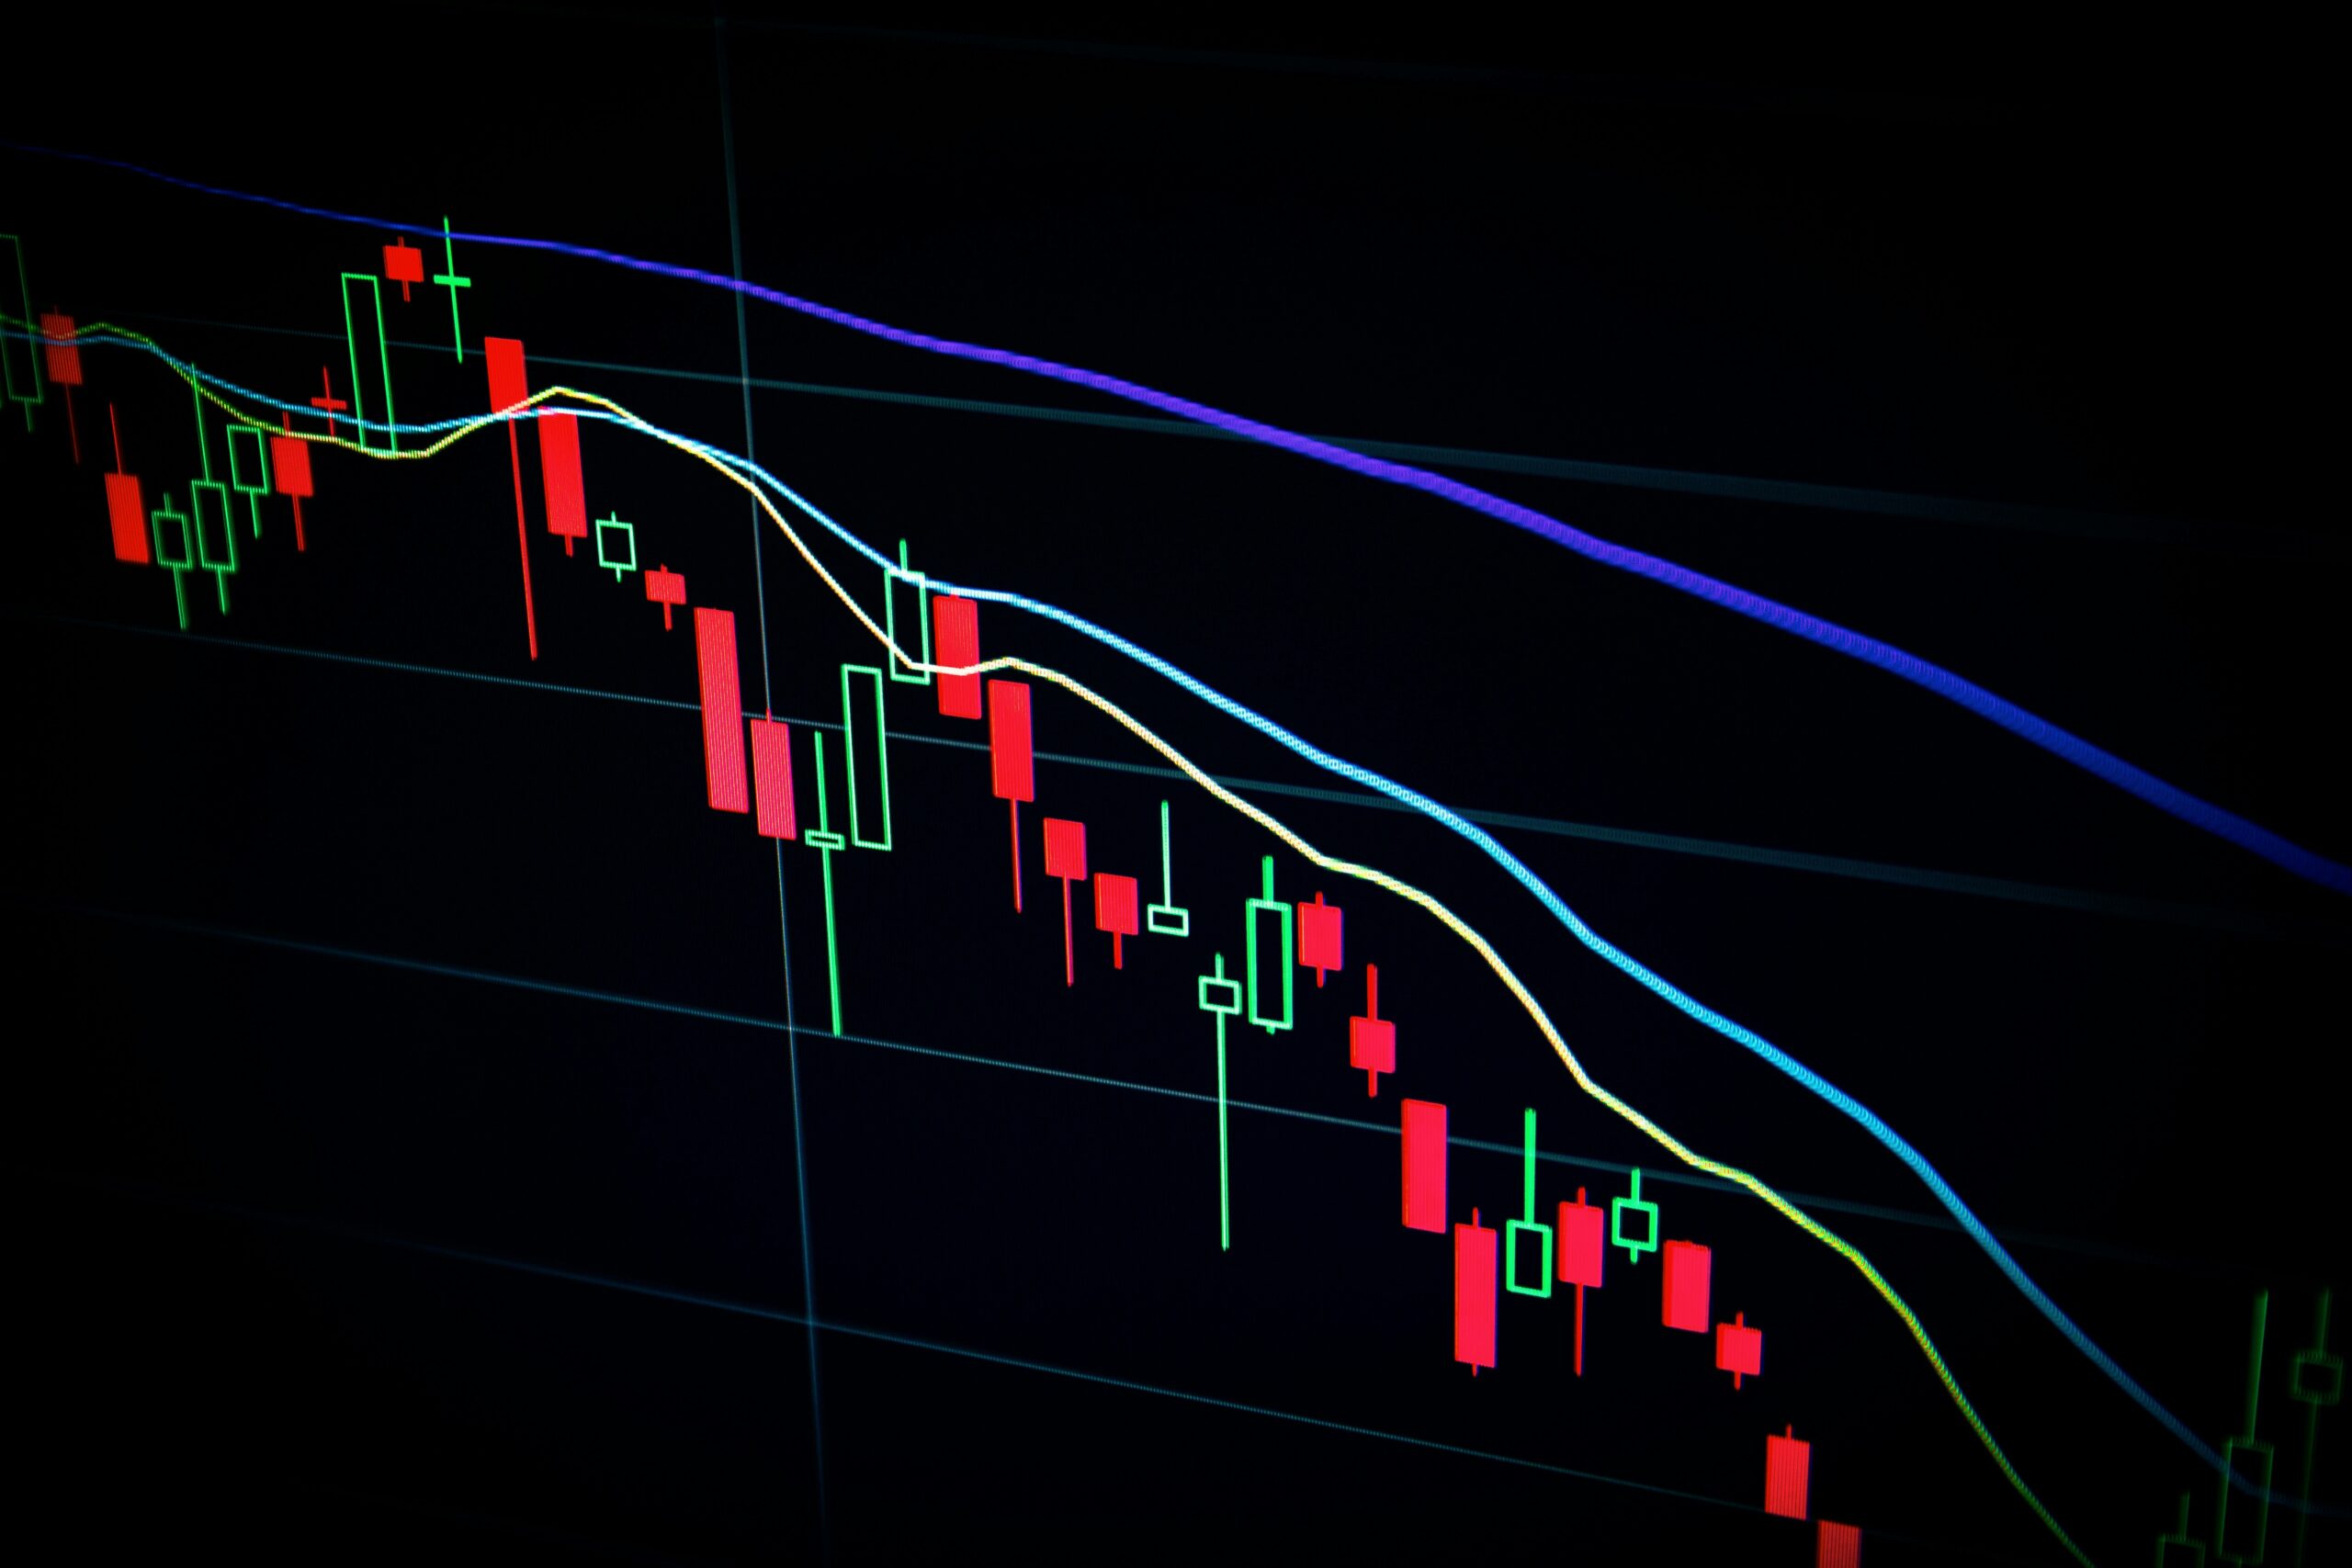
Courtesy:maxim-hopman from unsplash
Courtesy:maxim-hopman from unsplash
XRP has developed a pattern that investors can no longer ignore.
For three consecutive years, the cryptocurrency has posted weaker returns in March, raising fresh concerns as the calendar turns to March 2026. The token is already down 1.39% this month, extending a streak that began in 2023 and has steadily chipped away at early spring optimism.
While price performance may suggest another difficult month ahead, blockchain data tells a more layered story about what could happen next.
A three-year March slowdown
A review of XRP’s historical monthly performance reveals a clear downward progression since 2023.
In March 2023, XRP surged 43% as traders anticipated progress in the SEC v. Ripple legal battle. At the time, expectations surrounding a summary judgment from Judge Analisa Torres fueled aggressive buying activity. That rally became one of the token’s strongest single-month performances in recent years.
Momentum cooled the following year. In March 2024, XRP still finished in positive territory, gaining 7.11%, but the jump was far more modest compared to the prior year’s spike.
By March 2025, the trend reversed entirely. The token closed the month down 2.52%, reflecting fading enthusiasm and broader cooling across the crypto market.
Now in March 2026, XRP has again slipped into negative territory. Though the loss remains relatively small so far, the repeating pattern has prompted speculation about whether history is about to repeat itself for a fourth time.
On-chain signals hint at rising demand
Despite weaker price performance, blockchain metrics suggest underlying activity may be strengthening.
Data from Glassnode shows that XRP’s Network Value to Transactions ratio has declined significantly over the past month. This metric compares the cryptocurrency’s market capitalization to the volume of transactions occurring on its network.
When the ratio rises, it often signals that valuation is outpacing real usage, a setup that can precede price pullbacks. A falling ratio, however, can suggest that transaction activity is growing faster than market value, sometimes indicating that an asset may be undervalued.
At the same time, XRP balances on exchanges have ticked lower. Glassnode data places exchange-held supply at 12.93 billion XRP, marking a slight decline since mid-February. Reduced exchange balances can signal that holders are moving assets off trading platforms rather than preparing to sell.
Taken together, these indicators suggest that while sentiment appears cautious, network engagement has not collapsed. In fact, usage trends may be quietly improving.
Bearish pressure still dominates the chart
Technical indicators, however, show that sellers remain firmly in control.
On the daily chart, XRP’s Elder-Ray Index has stayed in negative territory since mid-January. This measure evaluates the strength of buyers versus sellers by comparing buying pressure against selling pressure.
Sustained negative readings point to persistent dominance by bears. The absence of a decisive shift suggests that even if demand is building beneath the surface, it has yet to translate into upward price momentum.
If selling pressure continues and new demand fails to accelerate, XRP could slide toward $1.11. That move would represent a significant drop from its current price near $1.37 and deepen the March downturn.
On the other hand, if buyers regain control and push the token above the key $1.42 resistance level, a climb toward $1.61 becomes possible. That would mark a notable reversal from the recent downward pattern.
For now, XRP stands at a familiar crossroads. March has not been kind to the cryptocurrency in recent years, but data beneath the surface suggests the narrative may be more complicated than price action alone indicates.
Whether 2026 continues the slide or breaks the streak remains one of the month’s most closely watched crypto storylines.
Source: CCN
About the Author

Praise Swint
Wpseo_editor
Praise Swint is a contributor at Revelence, covering stories across news, entertainment, and culture.